DNA Mutation Rates
and
Evolution
Sean D. Pitman M.D.
© August, 2001
(Updated November 2014)
|
Table of Contents
|
|
|
Mitochondrial DNA Mutation Rates
Mitochondria are "organelles" within living cells that are responsible for making the currency of energy called ATP (Adenosine Triphosphate), which all cells need to function. Mitochondria carry their own separate DNA (mtDNA) that is independent of the nuclear DNA of the same cell. Human mtDNA is composed of 37 genes totaling about 16,000 base pairs. This mtDNA also mutates at a much faster rate than nuclear DNA (nucDNA) does. Human mtDNA has been completely mapped and all the coding regions are known (as well as the proteins or RNA for which they code). Some of the mtDNA does not code for anything (thought to make these sections immune from "natural selection pressure"), and are known as the "control regions". One particular region appears to mutate faster than any other region (1.8 times faster), because the variation among humans is greatest here.4 When the cell divides, each cell takes some of the mitochondria with it. The mitochondria replicate themselves independently within the cell. Beyond this, it has been generally assumed that mitochondria are always passed on from the mother to the offspring without being involved with genetic shuffling and recombining of mtDNA with the mtDNA of the father. Recently, however, this notion has been challenged. As it turns out, many cases of paternally derived mtDNA have been detected in modern families of humans as well as other species. Consider the findings of an interesting study published by Schwartz and Vissing in the 2002 issue of the New England Journal of Medicine:
"Mammalian mitochondrial DNA (mtDNA) is thought to be strictly maternally inherited. Sperm mitochondria disappear in early embryogenesis by selective destruction, inactivation, or simple dilution by the vast surplus of oocyte mitochondria. . . The underlying mechanism responsible for the elimination of sperm mtDNA in normal embryos is not well understood. We speculate that the process in some cases may be defective, allowing sperm mitochondria to survive and giving those with a selective advantage the possibility of prevailing in certain tissues. . . Very small amounts of paternally inherited mtDNA have been detected by the polymerase chain reaction (PCR) in mice after several generations of interspecific backcrosses. Studies of such hybrids and of mouse oocytes microinjected with sperm support the hypothesis that sperm mitochondria are targeted for destruction by nuclear-encoded proteins. We report the case of a 28-year-old man with mitochondrial myopathy due to a novel 2-bp mtDNA deletion in the ND2 gene (also known as MTND2), which encodes a subunit of the enzyme complex I of the mitochondrial respiratory chain. We determined that the mtDNA harboring the mutation was paternal in origin and accounted for 90 percent of the patient's muscle mtDNA."47
So, what does such a finding mean with regard to mtDNA mutation rates and molecular clocks? Well, consider the following comments by Morris and Lightowlers published in a 2000 edition of The Lancet:
Mitochondrial DNA (mtDNA) is generally assumed to be inherited exclusively from the mother. Several recent papers, however, have suggested that elements of mtDNA may sometimes be inherited from the father. This hypothesis is based on evidence that mtDNA may undergo recombination. If this does occur, maternal mtDNA in the egg must cross over with homologous sequences in a different DNA molecule; paternal mtDNA seems the most likely candidate. If mtDNA can recombine, irrespective of the mechanism, there are important implications for mtDNA evolution and for phylogenetic studies that use mtDNA. 48
Before this evidence of paternal inheritance was discovered it was assumed that
mtDNA was strictly the result of maternal inheritance. Based on this
assumption, it was assumed that the mitochondrial offspring would get exact
copies of the mitochondria that the mother had except if there was a mutational
error.
This error rate in the non-coding portion of mitochondrial DNA has long
been thought to occur once every 300 to 600 generations, or every 6,000 to
12,000 years for humans.
The Berkeley biochemists who developed the theory, Allan Wilson, Rebecca Cann,
and Mark Stoneking, made several apparently reasonable assumptions. Since there
were no DNA changes due to genetic recombination events (ie: with paternal DNA -
now known to be a wrong assumption), they assumed that all changes in the mtDNA
were the result of mutations over time and that these mutations occurred at a
constant rate. On the basis of these assumptions, the researchers believed they
had access to something like a "molecular clock." Because mtDNA is thought to
mutate faster than nuclear DNA (nucDNA), it was thought that the faster mutation
rate of mtDNA would make for more accurate time keeping than nucDNA.
The original 1987 study involved mtDNA from 136 women from many parts of the
world having various racial backgrounds. The analysis seemed to support the idea
of a single ancestral mtDNA molecule from a woman living in sub-Saharan Africa
about 200,000 years ago. Later, more detailed studies seemed to confirm this
conclusion. Unfortunately though, there was a undetected bias in the computer
program as well as with the researchers themselves. The researchers used a
computer program designed to reveal a "maximum parsimony" phylogeny or the
family tree with the least number of mutational changes. This was based on
the assumption that evolution would have taken the most direct and efficient
path (which is not necessarily true, or even likely). Also, the computer program
was biased by the order of data entry to favor the information entered first.
This problem was recognized when the computer gave different results depending
on the order that the data was entered. Now, after thousands of computer runs
with the data entered randomly, it appears that the "African origin" for modern
humans does not hold a statistical significance over other possibilities.26
The problems with these studies were so bad that Henry Gee, a member of the
editorial staff for the journal, Nature, harshly described the studies as
"garbage." After considering the number of sequences involved (136 mtDNA
sequences), Gee calculated that the total number of potentially correct
parsimonious trees is somewhere in excess of one billion.25
Geneticist Alan Templeton (Washington University) suggests that low-level mixing
among early human populations may have scrambled the DNA sequences sufficiently
so that the question of the origin of modern humans and a date for "Eve" can
never be settled by mtDNA.22 In a letter to
Science, Mark Stoneking (one of the original researchers) acknowledged
that the theory of an "African Eve" has been invalidated.23
Another interesting aspect of the "molecular clock" theory is the way in which
the mutation rate itself was determined. Contrary to what many might think, the
mutation rate was not initially determined by any sort of direct analysis, but
by supposed phylogenic evolutionary relationships between humans and chimps. In
other words, the mutation rate was calculated based on the assumption that the
theory in question was already true. This is a rather circular assumption and as
such all results that are based on this assumption will be consistent with this
assumption - like a self-fulfilling prophecy. Since the rate was calculated
based on previous assumptions of evolutionary time, then the results will
automatically "confirm" the previous assumptions. If one truly wishes
independent confirmation of a theory, then one cannot calibrate the
confirmation test by the theory, or any part of the theory, that is being
tested. And yet, this is exactly what was done by scientists such as Sarich, one
of the pioneers of the molecular-clock idea. Sarich began by calculating the
mutation rates of various species "...whose divergence could be reliably dated
from fossils." He then applied that calibration to the chimpanzee-human split,
dating that split at from five to seven million years ago. Using Sarich's
mutation calibrations, Wilson and Cann applied them to their mtDNA studies,
comparing "...the ratio of mitochondrial DNA divergence among humans to that
between humans and chimpanzees."24 By this method, they calculated
that the common ancestor of all modern humans, the "African Eve", lived about
200,000 years ago.
Obviously then, these dates, calculated from the mtDNA analysis, must match the
presupposed evolutionary time scale since the calculation is based on this
presupposition. The circularity of this method is inconsistent with good
scientific method and is worthless as far as independent predictive value is
concerned. The "mitochondrial clock" theory was and is basically a theory within
a theory in that it has no independent predictive power outside of the theory of
evolution. It is surprising then that scientists did not catch this
inherent flaw earlier. Interestingly enough though, this flaw in reasoning
was not detected for many years and perhaps would have remained undetected for
much longer if a more direct mutation-rate analysis had not been done.
Eventually, scientists, who study historical families and their genetic
histories, started questioning the mutation rates that were based on
evolutionary phylogenetic assumptions.
These scientists were "stunned" to find that the mutation rate was in fact much
higher than previously thought. In fact it was about 20 times higher at
around one mutation every 25 to 40 generations (about 500 to 800 years for
humans). It seems
that in this section of the control region, which has about 610 base pairs,
humans typically differ from one another by about 18 mutations. 3 By
simple mathematics, it follows that modern humans share a common ancestor some
300 generations back in time. If one assumes a typical generation time of
about 20 years, this places the date of the common ancestor at around 6,000
years before present.
But how could this be?!
Thomas Parsons seems just as mystified. Consider his following comments
published April of 1997, in the journal Nature Genetics:
"The rate and pattern of sequence substitutions in the mitochondrial DNA (mtDNA)
control region (CR) is of central importance to studies of human evolution and
to forensic identity testing. Here, we report a direct measurement of the
intergenerational substitution rate in the human CR. We compared DNA sequences
of two CR hypervariable segments from close maternal relatives, from 134
independent mtDNA lineages spanning 327 generational events. Ten substitutions
were observed, resulting in an empirical rate of 1/33 generations, or 2.5/site/Myr.
This is roughly twenty-fold higher than estimates derived from phylogenetic
analyses. This disparity cannot be accounted for simply by substitutions at
mutational hot spots, suggesting additional factors that produce the discrepancy
between very near-term and long-term apparent rates of sequence divergence. The
data also indicate that extremely rapid segregation of CR sequence variants
between generations is common in humans, with a very small mtDNA bottleneck.
These results have implications for forensic applications and studies of human
evolution.
The calculation is done in the following way: Let us consider two randomly
chosen human beings. Assuming all human beings initially have
identical mitochondrial DNA,
after 33 generations, two such random human families will probably differ by two
mutations, since there will be two separate lines of inheritance and probably
one mutation along each line. After 66 generations, two randomly chosen humans
will differ by about four mutations. After 100 generations, they will differ by
about six mutations. After 300 generations, they will differ by about 18
mutations, which is about the observed value.
These experiments are quite concerning to evolutionists who previously calculated that the "mitochondrial eve" (who's mitochondria is thought to be the ancestor mitochondria to all living humans) lived about 100,000 to 200,000 years ago in Africa.1 The new calculations, based on the above experiments, would make her a relatively young ~6,500 years old. Now, the previous notion that modern humans are up to 10,000 generations old has to be reevaluated or at least the mtDNA basis for that assumption has to be reevaluated - and it has been.2
More recent direct mtDNA mutation rate studies also seem to confirm the earlier findings by Parsons and others. In an 2001 article published in the American Journal of Human Genetics, Evelyne Heyer et. al., presented their findings of the mtDNA mutation rate in deep-rooted French-Canadian pedigrees.
Their findings "Confirm[ed] earlier findings of much greater mutation rates in families than those based on phylogenetic comparisons. . . For the HVI sequences, we obtained 220 generations or 6,600 years, and for the HVII sequences 275 generations or 8,250 years. Although each of these values is associated with a large variance, they both point to ~7,000-8,000 years and, therefore, to the early Neolithic as the time of expansion [mostly northern European in origin] . . . Our overall CR mutation-rate estimate of 11.6 per site per million generations . . . is higher, but not significantly different, than the value of 6.3 reported in recent the recent pedigree study of comparable size . . . In another study (Soodyall et al. 1997), no mutations were detected in 108 transmissions. On the other hand, two substitutions were observed in 81 transmissions by Howell et al. (1996), and nine substitutions were observed in 327 transmissions by Parsons et al. (1997). Combining all these data (1,729 transmissions) results in the mutation rate of 15.5 (Cl 10.3-22.1). Taking into account only those from deep-rooting pedigrees (1,321 transmissions) (Soodyall et al. 1997; Sigurdardottir et al. 2000; the present study) leads to the value of 7.9. The latter, by avoiding experimental problems with heteroplasmy, may provide a more realistic approximation of the overall mutation rate." 44
Also, consider a 2003 paper published in the Annals of Human Genetics by B. Bonne-Tamir et al. where the authors presented their results of a their study of "Maternal and Paternal Lineages" from a small isolated Samaritan community. In this paper they concluded:
"Compared with the results obtained by others on mtDNA mutation rates, our upper limit estimate of the mutation rate of 1/61 mutations per generation is in close agreement with those previously published." 45 [compared with the rate determined by Parsons of 1/33 generations, a rate of 1/61 is no more than double]
One more interesting paper published in September 2000 in the Journal Scientist by Denver et al. is also quite interesting. These scientists reported their work with the mtDNA mutation rates of nematode worms and found that these worm's molecular clocks actually run about "100 times faster than previously thought" [emphasis added].46
"Extrapolating the results directly to humans is not possible, say the scientists. But their results do support recent controversial studies suggesting that the human molecular clock also runs 100 times faster than is usually thought. This may mean that estimates of divergence between chimpanzees and humans, and the emergence of modern man, happened much more recently than currently believed, says the team. 'Our work appears to support human analyses, which have suggested a very high rate,' says Kelley Thomas of the University of Missouri. 'This work is relevant to humans,' says Doug Turnbill of the institute for Human Genetics and Newcastle University, UK. 'If the human mutation rate is faster than thought, it would have a lot of impact in looking at human disease and forensics, as well as the evolutionary rate of humans.' . . .
Mutation rates of mtDNA in humans are usually estimated by comparing sequences of DNA from people and other animals. 'This is kind of analysis that was used to determine that the African origin of modern humans was about 200,000 years ago,' says Thomas. 'The problem with this approach is that you are looking at both the mutation rate and the effects of natural selection,' he says. The technique would also miss multiple mutations in the same stretch of mtDNA, says Paul Sharp of the Institute of Genetics at Nottingham University, UK.
More recent studies have looked at the mtDNA of people who are distantly related but share a female ancestor. This approach has revealed higher mtDNA mutation rates. But the results have not been accepted by many scientists [emphasis added].
Knowing the exact rate of mutation in humans is very important for forensic science and studies of genetic disease, stresses Turnbill. Forensic identification often rests on comparing samples of DNA with samples from suspected relatives. Faster human molecular clocks could complicate established exact relationships, he says." 46
Obviously then, these rates, based on more direct observations, are nowhere near those based on indirect evolutionary assumptions. This certainly does "complicate" things just a bit now doesn't it? Isn't it strange though that many scientists are still loath to accept these results? The bias in favor of both evolution as well as millions of years for assumed divergence times between creatures like apes and humans is so strong that changing the minds of those who hold such positions may be pretty much impossible.
There are many other potential problems for phylogenies that rely on mtDNA
sequence analysis and mutation rates. One problem is that mtDNA functions
as a single genetic locus, much like a single gene does in nucDNA. Studies
that work off a single genetic locus are more likely to be affected by random
genetic changes than are studies that include more than one locus (the more the
better). Therefore, single locus studies are less accurate in
characterizing a population. Beyond this, the new evidence for paternal
mtDNA mixing is quite problematic.16
Also, as briefly discussed above, the use of control regions as a "molecular
clock" may not be as valid as was previously hoped. Some nucleotide
regions mutate slowly, while others can mutate relatively rapidly.17
These mutational "hotspots" can mutate fairly rapidly even within a single
lifetime and are intuitively rather common in the aged.18 Of
course such "somatic" mutations arise in mitochondria of various bodily tissues
and, unless they involve gametes, they are not passed on to the next generation.
However, they would still affect phylogenetic interpretations. Scientists
have tried to compensate for these problems, but the various methods have
produced divergent results.19 Also, as discussed above, direct
comparisons of modern sequences with historical sequences often yield very
difference results from those estimated by indirect methods that are based on
present day sequence differences. For another example from a different
species, direct comparisons of modern penguins with historically sequenced
penguins have shown that their mtDNA mutation rates are 2 to 7 times faster than
had previously been assumed through indirect methods.20
Certain of these problems have in fact led some scientists to stop using
control-region sequences to reconstruct human phylogenies.21
Those scientist that continue to try and revise the molecular clock hypothesis have tried to slow down the clock by showing that some mtDNA regions mutate much more slowly than do other regions. The problem here is that such regions are obviously affected by natural selection. In other words, they are not functionally neutral with regard to selection pressures.
For example, real time experiments have shown that average mitochondrial genome mutation rates are around 6 x 10⁻⁸ mut/site/mitochondrial generation - in line with various estimates of average bacterial mutation rates (Compare with nDNA rate of 4.4 x 10⁻⁸ mut/site/human generation). With an average generation time of 45 days, that's about 5 x 10⁻⁶ mut/site/year and 5 mut/site/myr.
This is about twice as high as Parsons' rate of 2.5/mut/site/myr and about 40 to 50 times higher than rates based on phylogenetic comparisons and evolutionary assumptions. And, this is the average rate of the entire mitochondrial genome of 16,000pb. One might reasonably think that all aspects of the hypervariable regions (HVI & HVII) would have a higher than average rate of mutation if truly neutral with regard to functional selection pressures. Given this, those "slowly mutating sites" with rates as slow as 0.065 mut/site/myr (Heyer et al, 2001) would seem to be maintained in a biased way by natural selection.
Again, such non-neutral changes are not necessarily the reflection of elapsed time since a common ancestor so much as they are the reflection of the different functional needs of different creatures in various environments.
Nuclear DNA Mutation Rates
As with mitochondrial DNA mutation rates, the mutation rates of nuclear DNA have often been calculated based on evolutionary scenarios rather than on direct methods. By such methods, the average mutation rate for eukaryotes in general was, until fairly recently (see further discussion below), estimated to be about 2.2 x 10⁻⁹ mutations per base pair per year.29 With a 20 year average generation time for humans, this works out to be around 4.4 x 10⁻⁸ mutations per base pair per generation. Since most estimates of the size of the diploid human genome run around 6.3 billion base pairs, this mutation rate would give the average child around 277 mutational differences from his or her parents. This sounds like quite a high number and it is in fact on the high end of the spectrum when compared to studies looking more specifically at human mutation rates verses eukaryotic mutation rates in general. However, an original study by Nachman and Crowell, seemed to confirm this estimate by comparing control sequences in humans and chimpanzees. Using these sequence comparisons, "The average mutation rate was estimated to be ~2.5 x 10⁻⁸ mutations per nucleotide site or 175 mutations per diploid genome per generation" [Based on a higher diploid genome estimate of 7 billion base pairs]. 30
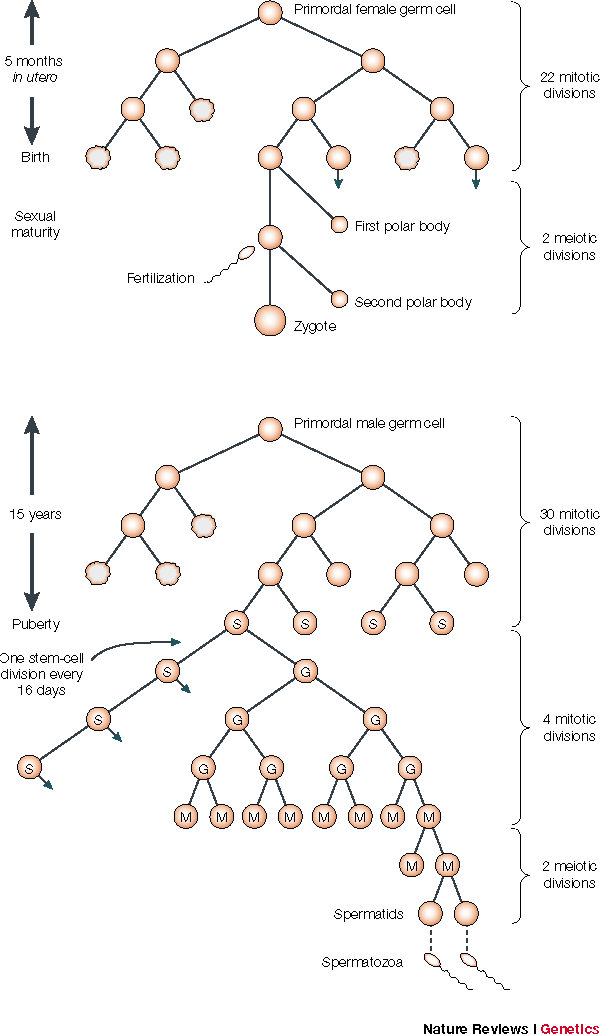
These non-direct mutation rate estimates also seemed reasonable given that they seemed to match the error rates of DNA replication that occur between the formation of a zygote in one generation and the formation of a zygote in the next generation. In the illustration31 below, notice that from fertilization to the formation of a woman's first functional gamete, it takes about 23 mitotic divisions. Men, on the other hand, contribute about twice as many germ line mutations as women on average.33 At least part of the reason is stem cells in men keep dividing so that the older a man gets before having children more mitotic divisions occur.
Now, consider that each diploid fertilized zygote contains around 6 billion base pairs of DNA (~3 billion from each gamete/parent, using a conservative round number).32 From cell division to cell division, the error rate for DNA polymerase combined with other repair enzymes is about 1 mistake in 1 billion base pairs copied.42 At this rate, there are about 6 mistakes with each diploid cell replication event. With a male/female average of 29 mitotic divisions before the production of the next generation, this works out to be about 175 mutations per generation.
Of course, this is right in line with the mutation rates that are based on
evolutionary scenarios.
On the other hand, more direct methods of detecting
the nuclear mutation rates in animals suggest that the actual measured rate is
often quite a bit different than rates suggested by evolutionary assumptions
(both higher and lower). For example, the observed mutation rate for C.
elegans was found to be ten times higher than estimates based on indirect
methods and evolutionary assumptions. Consider the following excerpt from Denver
et. al. published in Nature in 2004:
"Alternative approaches in mammals, relying on phylogenetic comparisons of pseudogene loci and fourfold degenerate codon positions, suffer from uncertainties in the actual number of generations separating the compared species and the inability to exclude biases associated with natural selection. Here we provide a direct and unbiased estimate of the nuclear mutation rate and its molecular spectrum with a set of C. elegans mutation-accumulation lines that reveal a mutation rate about tenfold higher than previous indirect estimates and an excess of insertions over deletions." (see Link)
Recently, there have also been some direct measurements of human mutation rates which are not quite in line with rates based on evolutionary assumptions. One paper in published in Science attempted a direct measurement of the mutation rate by comparing the complete genome sequences of two offspring and their parents. They estimate that each offspring had only 70 new mutations for a mutation rate of 1.1 x 10⁻⁸ per haploid genome per generation (Roach et al. 2010: Link). Now, this rate is for a haploid genome, which would be equivalent to a rate of ~140 mutations per diploid genome (i.e., pretty close to the rate noted above for a diploid genome of ~170 mutations per generation). If it's true then the time of divergence of humans and chimps would have to be set at 9 Myr and a lot of studies of recent human evolution could be off by a factor of at least two.
So, what's the big deal? Well, given a mutation rate of 140 per person per generation, and the fact that most mutations functional mutations are harmful, how is the human gene pool not degenerating over time? This might have been recognized as a significant conundrum if it were not for the fact that until about 2014 much of the human genome was long been thought by most scientists to have no significant functional role. It was therefore believed that it could therefore sustain quite a large number of mutations without any significant detrimental effect on the overall function of the organism. The amount of this non-functional DNA was once estimated by calculating the coding portion of DNA and subtracting this from the total genomic real estate. Given the average coding portion of a human gene at around 1,350 base pairs in size (coding for a protein about 450 amino acids in size)38 all one has to do is multiply this number by the total number of genes to arrive at a reasonable estimate of the total amount of coding genetic real estate - originally thought to be somewhere between 2-5% of the genome.
However, there was quite some
disagreement as to the total number of genes in the human genome for quite some
time.
For many years it was thought that humans had between 70,000 to 140,000
genes. However, scientists working on the
human genome project made a surprising discovery.
When they finished a rough draft of the project in February of 2001, they
estimated that the actual gene count was somewhere between 30,000 to 40,000
genes.39
But a year later, in February of 2002, at the annual meeting of the American
Association for the Advancement of Science (publisher of Science), one of
the presenters, Victor Velculescu, suggested that the real number of genes in
the human genome may actually be closer to 70,000 genes after all.40
Of course, the current estimate for the number of genes in
the genome is back down to 20-30,000.
However, this number is almost irrelevant now that non-protein-coding portions
of DNA, like many so-called pseudogenes and miro-RNAs, are now being found to
have significant functionality - along with other vast stretches of non-coding
DNA. In fact, it is now being suggested that a significant fraction of the human
genome is functional with estimates ranging between 16-20% (Kellis,
2014). Some estimates have gone even higher than that (see
Link).
It gets very complicated indeed. In fact, I'd say that "very
complicated" is a bit of an understatement when you've got the common ancestor
of humans and apes living with the dinosaurs...
The Detrimental Mutation Rate
and the Genetic Deterioration of Mankind
Those originally studying this question suggested a
detrimental mutation rate (Ud) of 1 to 3 per person per generation with at least
some scientists (Nachmann and Crowell, 2000) favoring at least 3 or more.30
Of course,
the actual detrimental mutation rates, as breifly noted above, are likely to be much
higher. In any case, even given these initial assumptions (since
detrimental mutations outnumber beneficial mutations by at least 1,000 to 1)
it seemed like the build up of detrimental mutations in a population might
lead toward extinction. 34,36
Nachmann and Crowell detail this perplexing situation in the following
conclusion from their paper on human mutation rates:
The high deleterious mutation rate in humans presents a paradox. If
mutations interact multiplicatively, the genetic load associated with such a
high U [detrimental mutation rate] would be intolerable in species with a low
rate of reproduction [like humans and apes etc.] . . .
The reduction in fitness (i.e., the genetic load) due to deleterious mutations
with multiplicative effects is given by 1 - e -U (Kimura and Moruyama
1966). For U = 3, the average fitness is reduced to 0.05, or put
differently, each female would need to produce 40 offspring for 2 to survive and
maintain the population at constant size. This assumes that all mortality
is due to selection and so the actual number of offspring required to maintain a
constant population size is probably higher.
The problem can be mitigated somewhat by soft selection or by selection early in
development (e.g., in utero). However, many mutations are unconditionally
deleterious and it is improbable that the reproductive potential on average for
human females can approach 40 zygotes. This problem can be overcome if
most deleterious mutations exhibit synergistic epistasis; this is, if each
additional mutation leads to a larger decrease in relative fitness. In the
extreme, this gives rise to truncation selection in which all individuals
carrying more than a threshold number of mutations are eliminated from the
population. While extreme truncation selection seems unrealistic [the
death of all those with a detrimental mutational balance], the results presented
here indicate that some form of positive epistasis among deleterious mutations
is likely.30
Nachmann and Crowell found this situation very puzzling. How does one get rid of all the bad mutations faster than they are produced? They proposed several possible solutions, such as a concept they called "positive epistasis". However, If the functional effects of mutations were increased in a multiplicative instead of additive fashion would this solve the problem? As noted above, even if every detrimental mutation caused the death of its owner, the reproductive burden of the survivors would not diminish, but would remain the same.
For example, lets say that all those with at least three detrimental mutations
die before reproducing. The population average would soon hover just above 3
deleterious mutation rates. Over 95% of each subsequent generation would
have 3 or more deleterious mutations as compared with the original "neutral"
population. The death rate would increase dramatically. In order to
keep up, the reproductive rates of those surviving individuals would have to
increase in proportion to the increased death rate. The same thing would
eventually happen if the death line were drawn at 100, 500, 1000, 10000 or more
deleterious mutations. The only difference would be the length of time it
would take a given population to build up a lethal number of deleterious
mutations in its gene pool beginning at a relatively "neutral" starting point.
The population might survive fairly well for many generations without having to
resort to huge increases in the reproduction rate. However, without
getting rid of the accumulating deleterious mutations, the population would
eventually find itself experiencing an exponential rise in its death rate as its
average population crossed the line of lethal mutations.
Since the theory of positive epistasis does not seem to help the situation much,
some other process must be found to explain how to preferentially get rid of
detrimental mutations from a population.
Consider an excerpt from a Scientific American article published in 1999
entitled, "Mutations Galore":
According to standard population genetics theory, the figure of three harmful mutations per person per generation implies that three people would have to die prematurely in each generation (or fail to reproduce) for each person who reproduced in order to eliminate the now absent deleterious mutations [75% death rate]. Humans do not reproduce fast enough to support such a huge death toll. As James F. Crow of the University of Wisconsin asked rhetorically, in a commentary in Nature on Eyre-Walker and Keightley's analysis: "Why aren't we extinct?"
Crow's answer is that sex, which shuffles genes around, allows detrimental
mutations to be eliminated in bunches. The new findings thus support the
idea that sex evolved because individuals who (thanks to sex) inherited several
bad mutations rid the gene pool of all of them at once, by failing to survive or
reproduce.
Yet natural selection has weakened in human populations with the advent of
modern medicine, Crow notes. So he theorizes that harmful mutations may
now be starting to accumulate at an even higher rate, with possibly worrisome
consequences for health. Keightley is skeptical: he thinks that many
mildly deleterious mutations have already become widespread in human populations
through random events in evolution and that various adaptations, notably
intelligence, have more than compensated. "I doubt that we'll have to pay
a penalty as Crow seems to think," he remarks. "We've managed perfectly well up
until now."
37
Perhaps then the answer might be found in a combination of processes where both sexual replication and natural selection play a role to keep a slowly reproducing population from going extinct. For example consider the following chart showing how deleterious mutations build up in a population that reproduces via asexual means: 49
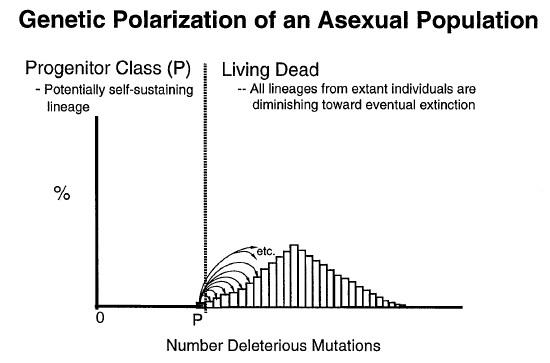
Notice how the most fit "Progenitor Class" (P) loss numbers in each generation while the numbers of those that have greater numbers of deleterious mutations build up more and more. In this article Rice notes that in asexual populations the only way to really overcome this buildup of detrimental mutations is to increase the reproductive rate substantially. But, what about beneficial mutations? Rice comments, "Rare reverse and compensatory mutations can move deleterious mutations, via genetic hitchhiking, against the flow of genetic polarization. But this is a minor influence, analogous to water turbulence that occasionally transports a pebble a short distance upstream." 49 So, how might sexually reproducing populations overcome this problem?
When it comes to sexually reproducing populations, the ability for genetic recombination during the formation of gametes makes it possible to concentrate both good and bad mutations. For example, lets say we have two individuals, each with 2 detrimental mutations. Given sexual recombination between these two individuals, there is a decent chance that some of their offspring (1 chance in 32) will not have any inherited detrimental mutations. But what happens when the rate of additional detrimental mutations is quite high? - say 3 per individual per generation?
To look into this just a bit more, consider another example of a steady state population of 5,000 individuals each starting out with 7 detrimental mutations and an average detrimental mutation rate of 3 per individual per generation. Given a reproductive rate of 4 offspring per each one of the 2,500 couples (10,000 offspring), in one generation, how many offspring will have the same or fewer detrimental mutations than the parent generation?
|
Inherited |
After Ud = 3 |
|
7 |
901 |
|
6 |
631 |
|
5 |
378 |
|
4 |
189 |
|
3 |
76 |
|
2 |
23 |
|
1 |
5 |
|
0 |
0.45 |
|
< or = 7 |
2202 |
This Poisson approximation shows that out of 10,000 offspring, only 2,202 of them would have the same or less than the original number of detrimental mutations of the parent population. This leaves 7,798 with more detrimental mutations than the parent population.51 Of course, in order to maintain a steady state population of 5,000, natural selection must cull out 5,000 of these 10,000 offspring before they are able to reproduce. Given a preference, those with more detrimental mutations will be less fit by a certain degree and will be removed from the population before those that are more fit (less detrimental mutations). Given strong selection pressure, the second generation might be made up of ~2,200 more fit individuals and only ~2,800 less fit individuals with the overall average showing a decline as compared with the original parent generation. If selection pressure is strong, so that the majority of those with more than 7 detrimental mutations are removed from the population, the next generation will only have about 1,100 mating couples as compared to 2,500 in the original generation. With a reproductive rate of 4 per couple, only 4,400 offspring will be produced as compared to 10,000 originally. In order to keep up with this loss, the reproductive rate must be increased or the population will head toward eventual genetic meltdown and extinction. In fact, given a detrimental mutation rate of Ud = 3 in a sexually reproducing population, the average number of offspring needed for natural selection to keep up with the detrimental mutation rate would be around 40 per breeding couple (2 * 1 / e-Ud). While this is about half that required for an asexual population it is still quite significant.
In this light, consider that several other studies argued that the deleterious mutation rate is even higher. "Extrapolations from studies of humans and Drosophila (Mukai, 1979; Kondroshov, 1988; Crow, 1993) suggest that Ud > 5 is feasible."49 Of course, the number of required offspring needed to compensate for a detrimental mutation rate of Ud = 5 would soar to 296 per female per generation! Even with the more modern discovery of a reduced overall mutation rate of around 70 point mutations per individual per generation, the deleterious mutation rate would still be even higher than this. For example, Peter D. Keightley argued in 2012 (Link) that with an overall mutation rate of just 70 new mutations per generation, the expected deleterious mutation rate would only be around "2.2 for the whole diploid genome per generation." That sounds pretty good (a necessary reproductive rate of "only" 18 offspring per woman per generation) until one considers that this estimate was based on the assumption that only "5% of the mammalian genome is under selection." However, since 2012, additional evidence has come to light strongly suggesting that much more than 5% of the genome is functional (and is therefore under selective pressure). For example, Kellis (2014) argues that:
"The lower bound
estimate that 5% of the human genome has been under evolutionary
constraint was based on the excess conservation observed in
mammalian alignments relative to a neutral reference (typically
ancestral repeats, small introns, or fourfold degenerate codon
positions). However, estimates that incorporate alternate
references, shape-based constraint, evolutionary turnover, or
lineage-specific constraint each suggests roughly two to three
times more constraint than previously (12-15%), and their union
might be even larger as they each correct different aspects of
alignment-based excess constraint.... Although still weakly
powered, human population studies suggest that an additional
4-11% of the genome may be under lineage-specific constraint
after specifically excluding protein-coding regions."
This means that, at minimum, between 16% to 26% of the genome is likely to be functionally constrained to one degree or another. And, of course, this means that the likely detrimental mutation rate is at least four times as high as Keightley suggested in 2012 (and some would argue even higher) - i.e., about 8.8 detrimental mutations per offspring per generation. This would, of course, imply a necessary reproductive rate of over 13,200 offspring per woman per generation (and a death rate of over 99.99% per generation).
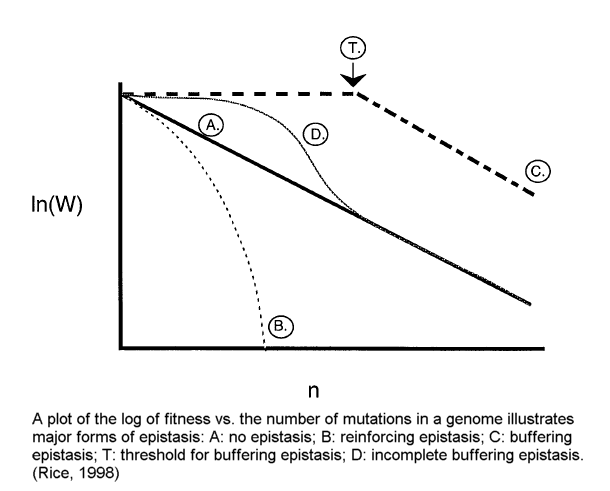
In short, the best available evidence overwhelmingly supports the theory that the human genome is in decay. The various forms of "positive epistasis" (see illustration by Rice below) 49 do not solve this problem.
November 2014
Overall mutation rate:
A fairly recent paper in a 2010 issue of Science attempted a direct
measurement of the mutation rate by comparing the complete genome sequences of
two offspring and their parents. They estimate that each offspring had only 70
new mutations (instead of previously predicted rates of around 170) for an
overall mutation rate of around 1.1 * 10-8 per site per generation
(Roach et al. 2010:
Link).
Another paper published in a 2010 issue of PNAS suggested an overall autosomal
mutation rate of 1.481 * 10−8 base substitutions per site per
generation - or approximately 89 new mutations per person per generation (Lynch,
2009:
Link).
Unfortunately for men, a 2009 pedigree-based estimate derived from
high-throughput sequencing of Y chromosomes (~58 million bp) separated by 13
generations (Xue et al. 2009:
Link) yielded a much higher base-substitutional mutation rate estimate of
3.0 * 10−8 for the Y-chromosome (~ 1.74 mutations per person, per
Y-chromosome alone, per generation - - comparable to a rate of ~180 autosomal
mutations per person per generation).
For purposes of discussion, let's assume an average SNP mutation rate of 70 per person, per generation.
Comment:
Note, however, that this mutation rate only represents point mutations. A mutation rate of 70 isn't truly representative of all types of mutations - such as deletions, insertions, duplications, translocations, inversions, micro-satellite mutations, various forms of indel mutations, etc. So, the actual mutation rate with regard to the absolute number of nucleotide changes over time would be higher than this. Consider, for example, that although "macro-mutations" (like larger insertions or deletions) occur at a rate of an additional 4-12 per person per generation, they actually change 100-500 times the number of nucleotides that are changed by all point mutations combined. So, the additional effective nucleotide mutation rate could be up to 30,000 nucleotide changes per person per generation. (Link).
Functional DNA in the Genome:
In the past five years or so, the discovery that a significant amount of
"non-coding DNA" is functional to one degree or another. Early on, it was
thought that no more than 1.5% of the human genome was functional. Although
there are about 23,000 protein-coding genes, these comprise a mere 1.5% of the
human genome. The rest of the genome is comprised of DNA sequences that do
not code for proteins. It is interesting to note that about 80% of the
non-coding DNA in the human genome is actually transcribed (Link),
mainly into non-protein-coding RNAs (Link).
Many of the observed non-coding transcripts are differentially expressed, and,
while most have not yet been studied, increasing numbers are being shown to be
functional and/or trafficked to specific subcellular locations, as well as
exhibit subtle evidence of selection. Even some of the 20% or so of the genome
that is not transcribed at all into any form of RNA, such as repetitive
sequences, is being shown to have functionality (in regulation of gene
expression, overall chromosome structure and pairing, etc). For example,
the non-transcribed spacer (NTS) region of rRNA genes is the "most important
region of the rDNA" because this is the region that contains the nucleotide
sequences that trigger and/or terminate transcription (Link).
Of course, analyses of conservation patterns indicate that only 5% (3% - 8%) of the human genome is under purifying selection for functions common to mammals. However, these estimates rely on the assumption that reference sequences (usually sequences thought to be ancient transposon-derived sequences) have evolved neutrally, which may not be the case (especially if common descent theories are wrong), and if so would lead to an underestimate of the fraction of the genome under selective constraint. These analyses also do not detect functional sequences that are evolving rapidly and/or have acquired lineage-specific functions. Indeed, many regulatory sequences and known functional noncoding RNAs, including many microRNAs, are not conserved over significant evolutionary distances, and recent evidence from the ENCODE project suggests that many functional elements show no detectable level of sequence constraint. Also, a 2010 report on research by Kunarso et al. in Nature suggests:
"Although sequence conservation has proven useful as a predictor of functional regulatory elements in the genome the observations by Kunarso et. al. are a reminder that it is not justified to assume in turn that all functional regulatory elements show evidence of sequence constraint." (Link)
Some even go on to argue that, "It is possible that much if not most of the human genome may be functional." (Pheasant and attick, 2007: Link) From the conclusion of their paper, Pheasant and Mattick write:
"It seems clear that 5% is a minimum estimate of the fraction of the human genome that is functional, and that the true extent is likely to be significantly greater. If the upper figure of 11.8% under common purifying selection in mammals from ENCODE (Margulies et al. 2007) is realistic across the genome as a whole, and if turnover and positive selection approximately doubles this figure (Smith et al. 2004), then the functional portion of the genome may exceed 20%. It is also now clear that the majority of the mammalian genome is expressed and that many mammalian genes are accompanied by extensive regulatory regions. Thus, although admittedly on the basis of as yet limited evidence, it is quite plausible that many, if not the majority, of the expressed transcripts are functional and that a major component of genomic information is rapidly evolving regulatory DNA and RNA. Consequently, it is possible that much if not most of the human genome may be functional. This possibility cannot be ruled out on the available evidence, either from conservation analysis or from genetic studies (Mattick and Makunin 2006), but does challenge current conceptions of the extent of functionality of the human genome and the nature of the genetic programming of humans and other complex organisms."
The science journal Nature also published a very interesting news feature along these lines (ENCODE: The human encyclopaedia, Sept 5, 2012). This article reports on the ongoing human genome project called the "Encyclopedia of DNA Elements" or ENCODE project where the researchers assigned function to much of what was previously described as "junk DNA" - going so far as to suggest functionality of at least 80% of the human genome. While this suggestion is likely a bit extreme, an estimate of at least 20% functionality does seem fairly conservative at the present time (Kellis, 2014).
Implied functional mutation rate::
Given that 20% of the genome is functional to one degree or another, this would
imply a functional (non-neutral) mutation rate of 11 per person per generation
(70 total mutations times 20% times the number of non-redundant or
non-synonymous mutations at about 80%). This is in line with the most
conservative estimates recently published in literature.
For example,
Kellis (2014)
argues that:
"The lower bound estimate that 5% of the human genome has been under evolutionary constraint was based on the excess conservation observed in mammalian alignments relative to a neutral reference (typically ancestral repeats, small introns, or fourfold degenerate codon positions). However, estimates that incorporate alternate references, shape-based constraint, evolutionary turnover, or lineage-specific constraint each suggests roughly two to three times more constraint than previously (12-15%), and their union might be even larger as they each correct different aspects of alignment-based excess constraint.... Although still weakly powered, human population studies suggest that an additional 4-11% of the genome may be under lineage-specific constraint after specifically excluding protein-coding regions."
This means that, at minimum, between 16% to 26% of the genome is likely to be functionally constrained to one degree or another. And, of course, this means that the likely detrimental mutation rate is at least four times as high as Keightley suggested in 2012 (and some would argue even higher) - i.e., about 8.8 detrimental mutations per offspring per generation. This would, of course, imply a necessary reproductive rate of over 13,200 offspring per woman per generation (and a death rate of over 99.99% per generation).
Ratio of beneficial vs.
detrimental mutations:
There are numerous published estimates ranging from 1/1000 to 1/1,000,000. A
1998 paper published in Genetica suggests a beneficial mutation rate (vs. the
total mutation rate) of approximately 1 in 1,000,000 (Gerrish and Lenski, 1998:
Link). Given that a significant portion if not most of the human genome is
functional to one degree or another, to a similar degree those mutations that
are not beneficial would be functionally detrimental to one degree or another.
In short, the ratio of beneficial vs. detrimental is very small - most likely
well below the ratio of 1/1000.
Detrimental mutation rate:
Given that the ratio of beneficial vs. detrimental mutations is so low (less
than 1/1000), the detrimental mutation rate would be very similar to the overall
functional mutation rate. In other words there would be between around 11
detrimental mutations (to include mostly near-neutral detrimental mutations) per
person per generation (with a more conservative estimate of at least 8.8
detrimental mutations; see discussion above).
Required reproductive/death rate
to compensate for detrimental mutation rate:
The reduction in fitness (i.e., the genetic load) due to deleterious mutations
with multiplicative effects is given by the formula of 1 - e-U
(Kimura and Moruyama, 1966). For a detrimental mutation rate (Ud) of
just 3 mutations per person per generation, the average fitness is reduced to 1
- 2.71828183 -3
= 0.95 of the original parental fitness level. The number of offspring, in a
sexually reproducing species, needed to maintain the population at the parental
level of fitness would therefore be: 1 / e-3 = 20 offspring per woman
per generation for just one to survive without any detrimental mutations.
Therefore, each woman would need to produce 40 offspring for 2 to survive
without any detrimental mutations to maintain the population at functional
genetic neutrality (at least a 90% death rate without considering genetically
non-related accidents). Of course, if the detrimental mutation rate were really
more like 11 per person per generation, the number of offspring needed, per
woman, to allow natural selection to deal with this degree of bad karma would be
around 2 * 1/e-11 = ~120,000 offspring per woman per
generation. Even with a much more conservative estimate of U = 8.8, the
required reproductive rate would be about 13,200 per woman per generation (quite
clearly an impossibility either way).
Now, one might argue that the actual detrimental mutation rate is much lower than this, but it is rather hard to believe that the minimum number of offspring required per woman would be remotely within the realm of feasibility, given what we've learned about the functionality of the non-coding elements of the genome in recent years. Humans simply do not reproduce remotely fast enough to keep up with the most conservative understanding of the minimum rate of detrimental mutations that hits every single member of the human gene pool in every generation.
Consider also that Hermann Joseph Muller, a famous pioneer in the field of genetics, argued that a detrimental mutation rate of just 0.5/person/generation (an average reproductive rate of 3 children per woman) would doom the human population to eventual extinction (H. J. Muller, 1950). After all, it was Muller who realized that, in effect, each detrimental mutation leads, ultimately, to one "genetic death," since each mutation can be eliminated only by death or failure to reproduce. Sexual recombination softens this conclusion somewhat (by about half), but does not really solve the problem - as discussed above. Also, various forms of truncation selection and quasi-truncation selection (Link) and positive epistasis (discussed above) really don't solve a problem of this magnitude either.
Within mainstream literature clear limitations to mutation rates are known because of this particular problem. Even rapidly reproducing bacteria and viruses have a fairly small limit to the number of mutations that can be sustained per generation. Based on research coming out of Harvard University, that number is less than 6 mutations per individual per generation - for bacteria and viruses as well as most other living things! This is a total number of mutations affecting functional regions of DNA – counting detrimental, beneficial, and neutral varieties.
"If enough mutations push an essential protein towards an unstable, non-functional structure, the organism will die. Shakhnovich's group found that for most organisms, including viruses and bacteria, an organism's rate of genome mutation must stay below 6 mutations per genome per generation to prevent the accumulation of too many potentially lethal changes in genetic material." (Link, Link-2, Link-3)
For viruses in particular, the limiting mutation rate was found to be just 2.5 mutations per genome per generation (Link). This is the total mutation rate, not just the detrimental mutation rate. Also, the population here is assumed to be infinite in size. For finite populations the maximum tolerable mutation rate would obviously be smaller. The smaller the population, the lower the mutation rate that can be tolerated without an eventual genetic meltdown.
But what about the effect of beneficial mutations?
"Whitlock included beneficial mutations and calculated that Ncrit ~(Udeleterious/Ubeneficial)1/3, which depends only on the balance of beneficial to deleterious mutations and not on the mutation rate itself. Both of those examples contradict our results, which show that Ncrit and τ depend dramatically on |U|. The dominant reason for the discrepancy is that those authors assumed that deleterious mutations occur 'one at a time,' which is not true when the rate that mutations are introduced (U) exceeds the rate at which selection removes them (~1/s). When U/s>>1, the population experiences 'Hill-Robertson interference', which both accelerates extinction and also makes analytic solutions intractable." (Link)
The Y-Chromosome Rapidly Headed for Extinction?
Also, what about the Y-chromosome in males? The Y-chromosome does not undergo significant sexual recombination. Are the males of slowly reproducing species, like humans, therefore headed for extinction at an even faster rate than females?
"The absence of recombination with a homologous partner means that it [The Y-chromosome] can never be repaired by recombination. This has led to suggestions that the Y is destined for extinction it will eventually dwindle to nothing. According to this model, its role in sex determination will eventually be taken on by genes elsewhere in the genome." 50
The author of the above quoted article goes onto point out that several species, like the Armenian mole vole, are able to reproduce without the Y chromosome. While this might explain where humans are headed, it doesn't seem quite clear as to just how the Y-chromosome could have evolved over millions of years of time given its relative inability to combat high detrimental mutation rates in humans. Of course, research (Jennifer Hughes, 2012) has shown that the human Y-chromosome is "remarkably similar" to that of the rhesus monkey. In an interview Hughes noted that, "For the most part, the gene content [for human vs. rhesus Y-chromosomes] has not changed for 25 million years." (Link). Based on the assumed evolutionary relationship between humans and monkeys, it seems then like men are not going extinct after all! - Phew! However, when one considers how high the actual detrimental mutation rate of the Y-chromosome really is (Link), it not only calls into serious question the survival of the Y-chromosome, but the entire notion of human-ape common descent from a shared common ancestor. In fact, this conclusion seems much more consistent with a study published a bit earlier in Nature (Hughes, 2010) that showed many striking differences between human and chimp chromosome structure, gene content, and even qualitatively unique genes between the two species. As far as looking at specific genes, the chimp and human Y-chromosomes seem to have a dramatic difference in gene content of up to 53%. In other words, the chimp is lacking approximately half of the genes found on a human Y-chromosome. Because genes occur in families or similarity categories, the researchers also sought to determine if there was any difference in actual gene categories. They found a shocking 33 percent difference. The human Y-chromosome contains a third more gene categories, entirely different classes of genes, compared to chimps.
Under evolutionary assumptions of long and gradual genetic changes, the Y-chromosome structures, layouts, genes, and other sequences should be much the same in both species, given only six million years or so since chimpanzees and humans supposedly diverged from a common ancestor. Instead, the differences between the Y-chromosomes are marked. R. Scott Hawley, a genetics researcher at the Stowers Institute in Kansas City, though not involved in the research, told the Associated Press, "That result is astounding." (Link)
Because virtually every structural aspect of the human and chimp Y-chromosomes is different, it is hard to arrive at an overall similarity estimate between the two. The researchers did postulate an overall 70 percent similarity, which did not take into account size differences or structural arrangement differences. This was done by concluding that only 70 percent of the chimp sequence could be aligned with the human sequence - not taking into account differences within the alignments.
In other words, 70 percent was a conservative estimate, especially when considering that 50 percent of the human genes were missing from the chimp, and that the regions that did have some similarity were located in completely different patterns. When all aspects of non-similarity (sequence categories, genes, gene families, and gene position) are taken into account, it is safe to say that the overall similarity is actually much lower than 70 percent. In fact, this difference is so striking that the authors of the Nature article described the discrepancy with the standard evolutionary model in a rather intriguing way:
"Indeed, at 6 million years of separation, the difference in MSY gene content in chimpanzee and human is more comparable to the difference in autosomal gene content in chicken and human, at 310 million years of separation." (Link)
Given the standard evolutionary model of origins, it is indeed rather stunning to consider that the human Y-chromosome looks just as different from a chimp as the other human chromosomes do from a chicken. How is this explained within the evolutionary mindset? Obviously, the believer in mainstream evolutionary models is now forced to invent more just-so stories of major chromosomal rearrangements and rapid generation of many new genes, along with vast amounts of regulatory DNA, within very short spans of evolutionary time. However, since each respective Y-chromosome appears fully integrated and interdependently stable with its host organism, the most logical inference from the Y-chromosome data, without any prior commitment to the evolutionary story of origins, is that humans and chimpanzees were each specially created as distinct creatures, or evolved over a far far greater period of time...
Additional research carried out in 2012 by scientists at the University of Oxford and the University of Chicago found that hotspot regions that determine the locations for genetic recombination during cellular meiosis in sexual reproduction showed "no overlap between humans and chimpanzees." (Link) This was an "extraordinarily unexpected finding" given the other similarities between humans and chimps. Professor McVean explains:
"Genetic recombination has been likened to shuffling a deck of cards, which ensures that children are given a different genetic 'hand' than their parents. We know that in many cases recombination occurs where a particular thirteen letter sequence is present -- this is like a run of hearts from ace to king determining where we cut the deck of cards. Because humans and chimpanzees are genetically very similar, we might explain that you can only 'cut the cards' at the same point -- in fact, we find that this is not true." (Link)
. sp;
References
Gibbons, A. Calibrating the
Mitochondrial Clock, S Science 279, Volume 279, Number 5347 Issue of 2 Jan
1998, pp. 28-29
Collins, F., M. Guyer, and A. Chakravarti,
Variations on a Theme: Human DNA Sequence Variation, Science
278:1580-1581, 28 November 1997, page 1581.
Genetics vol. 15, April 1997, pp. 363-367.
S. Horai, K. Hayasaka, R. Kondo, K. Tsugane, and N. Takahata,
Recent African origin of modern humans revealed by complete sequences of
hominoid mitochondrial DNAs,
Proc. Natl. Acad. Sci. USA 1995 Jan 17;92(2):532-536.
Dorit, R.L., Akashi, H. and Gilbert, W. 1995.
Absence of polymorphism at the ZFY locus on the human Y chromosome,
Science 268 (26 May 1995):1183-1185.
L. Simon Whitfield, John E. Sulston, and Peter N. Goodfellow,
Sequence Variation of the Human Y Chromosome, Nature 378 (1995), pp.
379-380.
V. Morell. The Origin of Dogs:
Running With the Wolves, Science 1997 June 13; 276 (5319):1647 (in
Research News).
C.
Vila, P. Savolainen, J. E. Maldonado, I. R. Amorim, J. E. Rice, R. L.
Honeycutt, K. A. Crandall, J. Lundeberg, and R. K. Wayne,
Multiple and Ancient Origins of the Domestic Dog,/i> Science, June 13, 1997,
vol. 276, no. 5319, pp. 1687-1689 (in Reports).
Multiple
independent transpositions of mitochondrial DNA control region sequences to
the nucleus, PNAS 1996
93: pp. 15239-15243.
JJ. Klicka and R. M. Zink. The
Importance of Recent Ice Ages in Speciation: A Failed Paradigm, Science
1997 September 12; 277 (5332): p. 1666 (in Reports).
Spetner,
Not by Chance, Judaica Press, Brooklyn, New York, 1997, page 92.
Moreel, V., Bacteria Diversify
Through Warfare, Science, Volume 278, October 24, 1997, page 575.
Kondrashev, A.S., 1988, Deleterious
mutations and the origin of sexual reproduction, Nature vol. 336 Dec. 1
pp. 435-440.
Ninth International Conference on Microbial Genomes, October 28th-November
1st, 2001. Gatlinburg, TN (
http://cgb.utmem.edu/meeting_reports/redwards_11_06_01.htm
)
http://genetics.hannam.ac.kr/lecture/Mgen02/Mutation%20Rates.htm
Williams, Sloan R., Napoleon A. Chagnon, and Richard S. Spielman (2002)
"Nuclear and mitochondrial genetic variation in the Yanomama: A test case
for ancient DNA studies of prehistoric populations." American Journal of
Physical Anthropology 117: 246-259.
Stoneking, Mark (2000) "Hypervariable sites in the mtDNA control region are
mutational hotspots." American Journal of Human Genetics 67:
1029-1032.
Nekhaeva, E., N.D. Bodyak, Y. Kraytsberg, S.B. McGrath, N.J. Van Orsouw, A.
Pluzhnikov, J.Y. Wei, J. Vijg, and K. Khrapko (2002) "Clonally expanded
mtDNA point mutations are abundant in individual cells of human tissues."
Proceedings of the National Academy of Sciences 99: 5521-5526.
Heyer, Evelyne, Ewa Zietkiewicz, Andrzej Rochowski, Vania Yotova, Jack
Puymirat, and Damian Labuda (2001) "Phylogenetic and familial estimates of
mitochondrial substitution rates: Study of control region mutations in
deep-rooting pedigrees." American Journal of Human Geneticss 69:
1113-1126.
Lambert, D.M., P.A. Ritchie, C.D. Millar, B. Holland, A.J. Drummond, and C.
Baroni (2002) "Rates of evolution in ancient DNA from penguins."
Sciencee
295: 2270-2273.
Ingman, Max, Henrik Kaessmann, Svante Paabo, and Ulf Gyllensten (2000),
Mitochondrial genome variation and the origin of modern humans, Nature
408: 708-713.
Barinaga, Marcia , African Eve' Backers Beat a Retreat, Science, 255
(7 February 1992): 687.
Hedges, S. Blair , Sudhir Kumar, Koichiro Tamura, and Mark Stoneking,
Human Origins and Analysis of Mitochondrial DNA Sequences, Science, 255
(7 February 1992): 737-739.
Wilson, Allan C., Cann, Rebecca L., The Recent African Genesis of
Humans,, Scientific American, April 1992.
Gee, Henry, Statistical Cloud over African Eden, Nature, 355 (13
February 1992): 583.
Lubenow, Marvin, The Apple Computer Bites the African Eve, Impact No.
229, Institute for Creation Research, July 1992
(http://www.icr.org/pubs/imp/imp-229.htm )
Parsons, Thomas J. A high observed substitution rate in the human
mitochondrial DNA control region, Nature Genetics vol. 15, April 1997,
pp. 363-367
Coghlan, Andy, Proceedings of the National Academy of Sciences (DOI:
10.1073/pnas.172510699) (http://www.newscientist.com/news/news.jsp?id=ns99992833span>)
Sudhir Kumar, Sankar Subramanian, Mutation Rates in Mammalian Genomes,
PNAS, January 22, 2002, Vol. 99, No. 2, p. 803-808. (
www.pnas.org/cgi/doi/10.1073/pnas.022629899
)
Nuchman, Michael W., Crowell, Susan L., Estimate of the Mutation Rate per
Nucleotide in Humans, Genetics, September 2000, 156: 297-304 (
http://www.genetics.org/cgi/content/full/156/1/2977span>? )
http://www.nature.com/cgi-taf/DynaPage.taf?file=/nrg/journal/v1/n1/full/nrg1000_040a_fs.html
http://www.bgsu.edu/departments/chem/midden/chem308/slides/DNARBW.pdf
Ben Shouse, American Association for the Advancement of Science Annual
Meeting, Human Gene Count on the Rise, Science Feb 22 2002: 1457. (
http://www.cs.unc.edu/~plaisted/ce/genome3.html
)
Beardsley, Tim , Mutations Galore, Scientific American, Apr99, Vol. 280 Issue 4, p32, 2p
http://users.rcn.com/jkimball.ma.ultranet/BiologyPages/H/HGP.html
Lemonick, M. Gene Mapper, Time,
Vol. 156, No. 26, pp110, 2001.
Shouse, Ben. American Association for the Advancement of Science Annual
Meeting: Human Gene Count on the Rise, Science, 22 Feb. 2002: 1457.
(http://www.cs.unc.edu/~plaisted/ce/genome3.html)
www.naturalselection.0catch.com/Files/GalatosidaseEvolution.htmlO:P>
http://info.bio.cmu.edu/courses/03231/LecF02/Lec18/lec18.html
EEvelyn Heyer, Ewa Zietkiewicz, Andrezej Rochowski, Vania Yotova, Jack Puymirat, and Damian Labuda, Phylogenetic and Familial Estimates of Mitochondrial Substitution Rates: Study of Control Region Mutations in Deep-Rooting Pedigrees. Am. J. Hum. Genet., 69:1113-1126. 2001 ( http://www.journals.uchicago.edu/AJHG/journal/issues/v69n5/013122/013122.text.html )
B. Bonn-Tamir, M. Korostishevsky, A. J. Redd, Y. Pel-Or, M. E. Kaplan and M. F. Hammer, Maternal and Paternal Lineages of the Samaritan Isolate: Mutation Rates and Time to Most Recent Common Male Ancestor, Annals of Human Genetics, Volume 67 Issue 2 Page 153 - March 2003 ( http://www.blackwell-synergy.com/links/doi/10.1046/j.1469-1809.2003.00024.x/full/ )
Denver DR, Morris K, Lynch M, Vassilieva LL, Thomas WK. High direct estimate
of the mutation rate in the mitochondrial genome of Caenorhabditis elegans.
Science. 2000 Sep 29;289(5488):2342-4. (
http://www.sciencemag.org/cgi/content/full/289/5488/2342?ck=nck
)
Also reported by: Emma Young, Running Slow, New Scientist, September 28,
2000. (
http://www.newscientist.com/news/news.jsp?id=ns226930
)
DNA, New England Journal of Medicine, 347:576-580, August 22. ( http://0-content.nejm.org.catalog.llu.edu/cgi/content/full/347/8/576 )
Morris, Andrew A. M., and Robert N. Lightowlers (2000), Can Paternal mtDNA be Inherited? The Lancet, 355:1290-1291, April 15. ( Full Text )
William R. Rice, Requisite mutational load, pathway epistasis, and deterministic mutation accumulation in sexual versus asexual populations, Genetica</ 102/103: 71-81, 1998. 71 (Full Textxt/a>)
IJ, Sex and Death, The Human Genome - In The Genome, September, 2003 (Full Text)
Poisson Distribution Calculator (Link)
Binomial Calculator (Link)
Clyde Winters (2007), "CCan parallel mutation and neutral genome selection explain Eastern African M1 consensus HVS-I motifs in Indian M haplogroups," Indian Journal of Human Genetics, 13(3):93-96. (Link)
Roach et al., Analysis of Genetic Inheritance in a Family Quartet by Whole-Genome Sequencing, Science, 30 April 2010: 328 (5978), 636-639.Published online 10 March 2010 (Link)
. Home Page . Truth, the Scientific Method, and Evolution
.
. Maquiziliducks - The Language of Evolution . Defining Evolution
.
.
Evolving the Irreducible
.
.
.
.
.
. DNA Mutation Rates . Donkeys, Horses, Mules and Evolution
.
.
. Amino Acid Racemization Dating . The Steppingstone Problem
.
.
Links to Design, Creation, and Evolution Websites
Since June 1, 2002